Partager Twitter Facebook Email Copy URL

This map was produced for the Rosa-Luxemburg-Stiftung—New York Office by Aurash Khawarzad.
To see more of his work visit www.AurashKhawarzad.com.
Download the full map here.
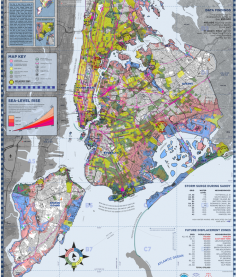
The New York City Climate Change Displacement Map is a large-format poster with information about two of the greatest contributors to the displacement of communities in New York City—climate change and gentrification.
The map of all five boroughs, with a close-up of Lower Manhattan on the reverse side, calculates displacement threats by analyzing three primary layers of data: 1) flooding during hurricane Sandy/hurricane evacuation zones; 2) income data, i.e., those making under $50,000 per year; and 3) cost of housing, i.e., high rent areas and areas in which renters spend over 50% of their income on housing expenses. Displacement Zones are areas where all three layers overlap.
This map contributes to the field of climate change analysis and planning by including housing and income data when calculating climate change displacement figures. It looks at who will suffer the greatest from floods, including in the outer boroughs. This is significant given the relationship between the geographic location of Displacement Zones and how people in those zones are typically subject to oppressive labor and housing policies, among other things.
The poster also shows correlations between historic displacement of indigenous peoples and the contemporary gentrification of communities of color, and it visualizes future gentrification plans along the waterfront. Even under the threat of environmental devastation and mass poverty, New York City participates in a building boom of waterfront luxury high-rises. This map encourages planning efforts to focus on preventing displacement in high impact areas rather than continuing the path of waterfront gentrification.
The map functions as a poster or a pamphlet that can be carried with you. The usability of the pamphlet harkens back to a period in time when maps were craft-made and indispensable tools, which have now largely been replaced by commercial apps on the “smartphone.” The flexible size and portability of the map make it a conversation piece and something that can be used by groups for a lecture, in a workshop, or at a conference.


